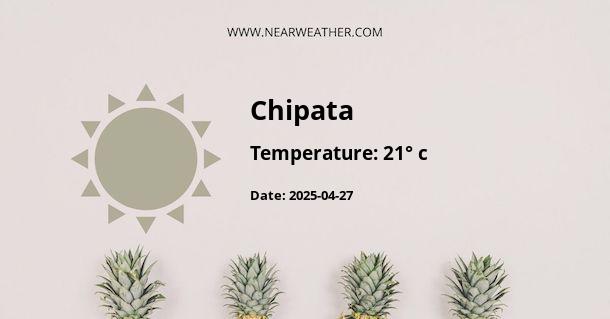
Climate and Weather in Chipata, Zambia
Chipata is a city located in the Eastern Province of Zambia, and it experiences a subtropical climate with distinct wet and dry seasons. The city is known for its warm temperatures, beautiful landscapes, and diverse wildlife. Understanding the climate and weather patterns in Chipata is important for residents and visitors alike. In this article, we will explore the climate of Chipata throughout the year, including temperature variations, rainfall patterns, and other relevant weather information.
Temperature
The temperature in Chipata remains relatively high throughout the year due to its location in a tropical region. The city experiences hot summers and mild winters. The average high temperatures range from 28°C (82°F) in the cooler months to 34°C (93°F) during the hotter months.
During the summer months of November to March, Chipata experiences its highest temperatures. These months are characterized by scorching heat, with average daily highs around 32°C (90°F) to 34°C (93°F). The nights are warm and rarely drop below 20°C (68°F).
In the winter months of May to August, Chipata experiences cooler temperatures. The average daily highs range from 25°C (77°F) to 28°C (82°F), and the nights can be quite chilly with temperatures dropping to around 10°C (50°F) to 15°C (59°F). However, it is important to note that winter temperatures in Chipata are still relatively mild compared to many other parts of the world.
Rainfall
Chipata has a distinct wet and dry season. The rainy season typically begins in November and lasts until March, with December and January being the wettest months. During this period, the city receives a significant amount of rainfall, which is vital for agriculture and the overall ecosystem of the region.
On average, Chipata receives around 1,000 to 1,200 millimeters (39 to 47 inches) of rainfall annually. The wettest months can see rainfall amounts exceeding 150 millimeters (6 inches) per month. The rain showers are often intense but relatively short-lived, followed by sunny periods. It is advisable to carry an umbrella or raincoat during the rainy season.
The dry season in Chipata occurs from April to October. During this period, rainfall is scarce, and the city experiences sunny and dry weather. The humidity levels are lower, and the days are generally warm and pleasant. This is a popular time for tourism and outdoor activities in the region.
Wind and Humidity
Chipata experiences moderate wind speeds throughout the year, with occasional gusts during thunderstorms. The prevailing winds come from the southeast during the dry season and shift to the north during the wet season. These wind patterns contribute to the overall climate and weather conditions in the region.
The humidity levels in Chipata vary depending on the season. During the wet season, the humidity can be quite high, especially after rainfall. However, the dry season is characterized by lower humidity levels, making it more comfortable for outdoor activities.
Climate Chart and Weather Averages
To provide a clearer understanding of the climate in Chipata, the following table presents average monthly temperatures and precipitation:
| Month | Average High (°C) | Average Low (°C) | Rainfall (mm) |
|---|---|---|---|
| January | 32 | 20 | 150 |
| February | 32 | 20 | 130 |
| March | 32 | 19 | 100 |
| April | 31 | 17 | 40 |
| May | 29 | 12 | 10 |
| June | 27 | 10 | 5 |
| July | 27 | 10 | 1 |
| August | 29 | 13 | 1 |
| September | 32 | 17 | 4 |
| October | 32 | 19 | 30 |
| November | 32 | 20 | 90 |
| December | 32 | 20 | 120 |
The climate chart above demonstrates the average monthly temperatures in Chipata, along with the corresponding average low temperatures and monthly rainfall amounts. It is important to note that these values are approximate and can vary slightly from year to year.
Best Time to Visit
The best time to visit Chipata depends on personal preferences and the type of activities one wishes to engage in. The dry season, from April to October, is generally considered the best time to visit for outdoor activities such as wildlife safaris, hiking, and exploring the natural beauty of the region.
However, the wet season also has its own charm, with lush green landscapes, vibrant flora, and the opportunity to witness the region's agricultural activities. The wet season is a great time to experience the local culture and festivals.
It is important to note that the climate and weather in Chipata can be unpredictable at times, and sudden weather changes can occur. It is advisable to check weather forecasts before planning any outdoor activities.
Conclusion
Chipata, Zambia, experiences a subtropical climate with distinct wet and dry seasons. The city enjoys warm temperatures throughout the year, with hot summers and mild winters. The wet season brings significant rainfall, while the dry season is characterized by sunny and dry weather. Understanding the climate and weather patterns in Chipata is essential for planning activities and making the most of the city's natural beauty and cultural offerings.
A - Chipata's Latitude is -13.633330 & Longitude is 32.650002.
A - Weather in Chipata is 21° today.
A - Climate Conditions in Chipata shows light rain today.
A - Humidity in Chipata is 81% today.
A - Wind speed in Chipata is 9.58 km/h, flowing at 165° wind direction. today.
