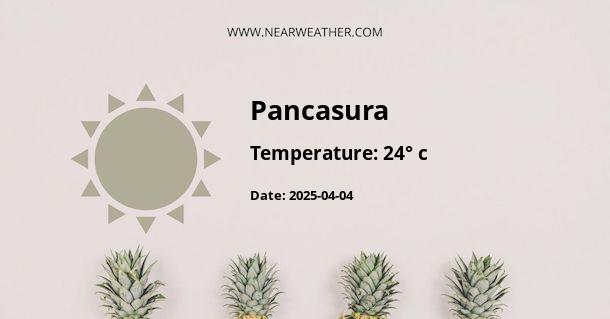
Climate and Weather in Pancasura, Indonesia
Pancasura, a picturesque town located in Indonesia, experiences a tropical rainforest climate, marked by consistent temperatures throughout the year and abundant rainfall. Understanding the climate and weather patterns of Pancasura is essential for travelers and locals to plan their activities and make the most of their time in this beautiful region.
Temperature in Pancasura
The climate in Pancasura is characterized by warm and consistent temperatures year-round. The town experiences little variation in temperature, with average highs ranging between 30°C (86°F) and 32°C (89.6°F) and average lows between 22°C (71.6°F) and 24°C (75.2°F) throughout the year. This stability in temperature provides a comfortable and inviting environment for visitors and residents alike.
Rainfall in Pancasura
Pancasura receives significant rainfall throughout the year, contributing to its lush and verdant surroundings. The town experiences a wet season from November to March and a dry season from April to October. During the wet season, Pancasura receives between 200mm to 300mm of rainfall per month, while the dry season sees significantly reduced rainfall, with an average of 50mm to 100mm per month. The ample rainfall sustains the region's diverse flora and adds to its natural charm.
Humidity in Pancasura
Due to its tropical rainforest climate, Pancasura experiences high humidity levels throughout the year. Humidity levels typically range from 70% to 90%, creating a tropical and lush environment. Visitors to Pancasura should be prepared for the high humidity and plan their activities accordingly.
Best Time to Visit Pancasura
The best time to visit Pancasura is during the dry season, which spans from April to October. The reduced rainfall during this period offers ideal conditions for outdoor activities, sightseeing, and exploring the natural beauty of the region. Travelers seeking to experience Pancasura's vibrant ecosystem and stunning landscapes should plan their visit during the dry season for a more enjoyable and rewarding experience.
Climate Chart for Pancasura
Below is a climate chart depicting the average monthly temperature and rainfall in Pancasura:
| Month | Jan | Feb | Mar | Apr | May | Jun | Jul | Aug | Sep | Oct | Nov | Dec |
|---|---|---|---|---|---|---|---|---|---|---|---|---|
| Average High (°C) | 32 | 32 | 32 | 32 | 32 | 31 | 31 | 31 | 31 | 31 | 31 | 32 |
| Average Low (°C) | 23 | 23 | 23 | 23 | 23 | 23 | 22 | 22 | 22 | 23 | 23 | 23 |
| Rainfall (mm) | 280 | 290 | 290 | 200 | 150 | 80 | 60 | 50 | 80 | 110 | 210 | 260 |
Overall, Pancasura's climate offers a warm and inviting atmosphere, allowing visitors to immerse themselves in its stunning natural features and vibrant ecosystem. Whether exploring the lush rainforests, partaking in outdoor adventures, or simply enjoying the town's unique charm, Pancasura welcomes all with its delightful climate and picturesque surroundings.
A - Pancasura's Latitude is -7.463700 & Longitude is 107.934196.
A - Weather in Pancasura is 24° today.
A - Climate Conditions in Pancasura shows overcast clouds today.
A - Humidity in Pancasura is 93% today.
A - Wind speed in Pancasura is 2.12 km/h, flowing at 143° wind direction. today.
