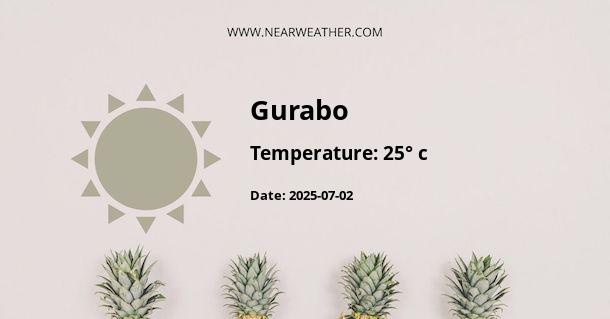
Gurabo Municipio, Puerto Rico Weather and Climate Overview
Gurabo Municipio, located in the central region of Puerto Rico, experiences a tropical rainforest climate with consistently warm temperatures throughout the year. Understanding the weather patterns and climate of Gurabo Municipio is essential for residents, visitors, and businesses in the area. Let's delve into a comprehensive overview of the weather and climate in this region.
Gurabo Municipio Weather by Season
Understanding the weather patterns by season is crucial for planning various activities and events in Gurabo Municipio. Here's a detailed breakdown of the weather by season:
Summer (June - August)
During the summer months, Gurabo Municipio experiences hot and humid weather with average high temperatures ranging from 85°F to 89°F. This period also sees frequent afternoon showers and thunderstorms, contributing to the high annual precipitation in the region.
Fall (September - November)
Autumn brings relatively consistent temperatures to Gurabo Municipio, with average highs ranging from 85°F to 88°F. However, this season marks the peak of the hurricane season in the Caribbean, increasing the likelihood of tropical storms affecting the region. It's essential for residents to stay informed and prepared during this time.
Winter (December - February)
Winter in Gurabo Municipio is characterized by warm and pleasant weather, with average high temperatures ranging from 82°F to 85°F. The region experiences lower precipitation during this season, making it an ideal time for outdoor activities and tourism.
Spring (March - May)
Spring brings rising temperatures to Gurabo Municipio, with average highs ranging from 83°F to 87°F. The region experiences an increase in humidity and occasional showers as it transitions into the summer months.
Gurabo Municipio Climate Data
Examining the climate data provides a deeper understanding of the weather patterns and averages in Gurabo Municipio. Let's take a look at the climate data for this region:
| Month | Average High (°F) | Average Low (°F) | Precipitation (inches) |
|---|---|---|---|
| January | 82 | 68 | 3.1 |
| February | 82 | 68 | 2.1 |
| March | 83 | 68 | 2.3 |
| April | 84 | 69 | 5.3 |
| May | 85 | 71 | 6.0 |
| June | 86 | 72 | 5.1 |
| July | 87 | 72 | 5.5 |
| August | 87 | 72 | 5.8 |
| September | 87 | 72 | 6.3 |
| October | 86 | 72 | 6.5 |
| November | 84 | 70 | 6.3 |
| December | 83 | 69 | 4.3 |
Source: The Weather Channel
Gurabo Municipio Annual Weather Patterns
Understanding the annual weather patterns in Gurabo Municipio is crucial for long-term planning and decision-making. Here's an overview of the typical weather patterns in the region:
- High temperatures: Gurabo Municipio experiences consistently high temperatures throughout the year, with average highs ranging from 82°F to 87°F.
- Precipitation: The region receives significant annual precipitation, with an average of 60 inches per year. The wettest months are typically from August to November, coinciding with the peak of hurricane season.
- Hurricane risk: As part of the Caribbean, Gurabo Municipio is susceptible to tropical storms and hurricanes, especially during the peak of the hurricane season from August to October.
Conclusion
Gurabo Municipio's tropical rainforest climate brings consistently warm temperatures and significant precipitation throughout the year. Understanding the seasonal weather patterns and climate data is essential for residents, businesses, and visitors to make informed decisions and preparations. With a thorough understanding of Gurabo Municipio's weather and climate, individuals and organizations can adapt and plan for the varying conditions in the region.
A - Gurabo's Latitude is 18.271620 & Longitude is -65.971832.
A - Weather in Gurabo is 25° today.
A - Climate Conditions in Gurabo shows light rain today.
A - Humidity in Gurabo is 87% today.
A - Wind speed in Gurabo is 5.54 km/h, flowing at 130° wind direction. today.
