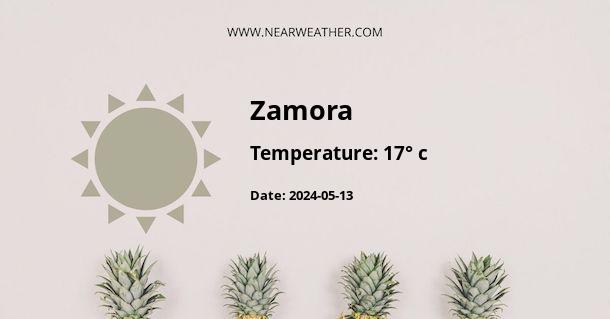
Zamora de Hidalgo, Mexico: A Comprehensive Guide to Its Climate and Weather Year Round
Zamora de Hidalgo, commonly known as Zamora, is a city located in the state of Michoacán, Mexico. Its climate is influenced by its geographical location, making it an interesting study in terms of weather patterns. Understanding the climate and weather in Zamora throughout the year is crucial for both residents and visitors, whether for agricultural purposes, tourism, or simply to plan day-to-day activities.
Climate Overview
Zamora experiences a semi-arid climate with distinct wet and dry seasons. The city's location in the Bajío region of Mexico contributes to its climate patterns. The Bajío region is known for its relatively flat terrain, which allows for the existence of a semi-arid climate. The city is characterized by hot, dry summers and mild winters. It is important to delve into the specific weather patterns to understand the city's climate thoroughly.
Temperature
The temperature in Zamora varies significantly throughout the year. Summers are hot, with temperatures often reaching into the high 80s and 90s F (above 30°C). The hottest months are typically May through July. Winters are milder, with temperatures ranging from the 40s to 70s F (4°C to 20°C). The coldest months are generally December and January. Overall, Zamora experiences a notable temperature fluctuation, with distinct differences between summer and winter.
Precipitation
Zamora's precipitation patterns are a crucial aspect of its climate. The city experiences a distinct wet season and dry season. The wet season typically begins in late May and continues through September. During this period, the city receives the majority of its annual precipitation. The dry season spans from October to April, with significantly lower rainfall. This distinct division between wet and dry seasons plays a pivotal role in the city's agricultural practices and overall ecosystem.
Weather Patterns by Month
Understanding the weather in Zamora month by month provides valuable insight into the city's climate variations. Here is a detailed overview of the weather patterns throughout the year:
| Month | Average High (°F) | Average Low (°F) | Average Precipitation (inches) |
|---|---|---|---|
| January | 74 | 46 | 0.5 |
| February | 76 | 47 | 0.3 |
| March | 80 | 49 | 0.2 |
| April | 85 | 53 | 0.2 |
| May | 87 | 57 | 1.1 |
| June | 84 | 60 | 4.4 |
| July | 82 | 59 | 5.4 |
| August | 82 | 59 | 6.2 |
| September | 81 | 58 | 4.4 |
| October | 80 | 55 | 1.8 |
| November | 78 | 50 | 0.5 |
| December | 75 | 47 | 0.4 |
As evidenced by the data, Zamora experiences a significant increase in precipitation during the summer months, particularly in June, July, and August. These months coincide with the city's wet season, showcasing the pronounced impact of seasonal variation on weather patterns.
Conclusion
Zamora de Hidalgo's climate and weather are influenced by its geographical location, resulting in distinct seasonal variations in temperature and precipitation. Understanding the city's climate year-round is essential for various sectors, including agriculture, tourism, and urban planning. This comprehensive guide provides valuable insight into the climate and weather patterns in Zamora, Mexico, aiding both residents and visitors in their understanding and preparation for the city's diverse climatic conditions.
A - Zamora's Latitude is 19.983330 & Longitude is -102.266670.
A - Weather in Zamora is 17° today.
A - Climate Conditions in Zamora shows clear sky today.
A - Humidity in Zamora is 51% today.
A - Wind speed in Zamora is 6.41 km/h, flowing at 146° wind direction. today.
