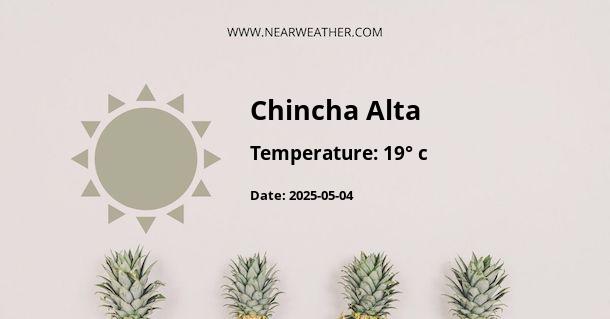
Chincha Alta, Peru: A Comprehensive Guide to Its Climate and Weather Year Round
Chincha Alta is a fascinating city located in the Ica Region of Peru. Known for its rich history, diverse culture, and stunning landscapes, Chincha Alta is a popular destination for travelers seeking to explore the beauty of the Peruvian coast. Understanding the climate and weather patterns of Chincha Alta is essential for anyone planning to visit this enchanting city. From temperature variations to precipitation levels, this guide provides a detailed overview of the climate and weather in Chincha Alta throughout the year.
Climate Overview
Chincha Alta experiences a desert climate, characterized by warm temperatures, minimal rainfall, and a unique landscape shaped by the coastal desert environment. The city is situated in close proximity to the Pacific Ocean, influencing its climate patterns and creating distinct weather conditions throughout the year.
Temperature
The temperature in Chincha Alta remains relatively consistent year-round, with warm to hot conditions prevailing throughout the seasons. The average annual temperature is around 23°C (73°F), with minimal fluctuations between summer and winter months.
The summer months, from December to March, bring the highest temperatures, with average highs reaching around 29°C (84°F) and occasional peaks exceeding 35°C (95°F). In contrast, the winter months, from June to September, experience slightly cooler temperatures, with average highs around 22°C (72°F).
Despite the warm climate, evenings and nights in Chincha Alta can experience noticeable cooling, with temperatures dropping to around 17°C (63°F) on average.
Precipitation
Chincha Alta is known for its arid climate, receiving minimal rainfall throughout the year. The annual precipitation is approximately 10 mm (0.39 inches), with the majority of rainfall occurring during the winter months, between June and September.
Due to its location within the coastal desert, Chincha Alta experiences limited cloud cover and a high number of sunny days, contributing to its dry climate and minimal precipitation levels.
Seasonal Weather Patterns
Understanding the seasonal variations in weather is crucial for planning a visit to Chincha Alta. Each season brings its own unique characteristics and activities, offering visitors diverse experiences across different times of the year.
Summer (December to March)
Summer is the peak tourist season in Chincha Alta, attracting visitors with its warm weather and clear skies. The city comes alive with cultural events, outdoor activities, and vibrant celebrations during this time. With average temperatures ranging from 25°C to 29°C (77°F to 84°F), it's the perfect season to explore the coastal charm of Chincha Alta and indulge in its rich heritage.
Autumn (April to May)
Autumn marks the transition from the hot summer to the mild winter in Chincha Alta. Temperatures begin to gradually decrease, offering a pleasant climate for outdoor excursions and sightseeing. With average temperatures ranging from 23°C to 26°C (73°F to 79°F), this season provides a comfortable environment for exploring the city and its surrounding attractions.
Winter (June to September)
Winter brings cooler temperatures to Chincha Alta, making it an ideal time for visitors who prefer milder weather. The average temperatures range from 19°C to 22°C (66°F to 72°F) during the day, with cooler nights. While rainfall is minimal, visitors should be prepared for occasional overcast days and cooler evenings. Winter in Chincha Alta offers a tranquil atmosphere, perfect for exploring the city's cultural sites and enjoying its local cuisine.
Spring (October to November)
Spring heralds the transition to warmer weather in Chincha Alta, marking the beginning of the build-up to the summer season. With temperatures gradually rising from around 22°C to 25°C (72°F to 77°F), spring provides an inviting climate for outdoor activities and nature expeditions. It's a great time to witness the natural beauty of Chincha Alta and engage in outdoor adventures before the peak summer season.
Weather Statistics
Understanding the statistical data related to the climate and weather in Chincha Alta provides valuable insights into the city's atmospheric conditions. The following table outlines the average monthly temperature and precipitation levels in Chincha Alta:
| Month | Average Temperature (°C) | Precipitation (mm) |
|---|---|---|
| January | 25°C | 2mm |
| February | 26°C | 1mm |
| March | 26°C | 1mm |
| April | 23°C | 0mm |
| May | 21°C | 0mm |
| June | 20°C | 0mm |
| July | 19°C | 1mm |
| August | 19°C | 1mm |
| September | 20°C | 1mm |
| October | 21°C | 0mm |
| November | 22°C | 0mm |
| December | 24°C | 1mm |
Conclusion
Chincha Alta's climate and weather present a delightful blend of warm temperatures, minimal rainfall, and diverse seasonal experiences. Whether visiting during the summer's lively festivities or exploring the tranquil winter ambiance, Chincha Alta offers an inviting climate year-round. Understanding the nuances of its climate and weather patterns enhances the travel experience and enables visitors to make the most of their time in this captivating Peruvian city.
Environmental Data Source: National Meteorology and Hydrology Service of Peru (SENAMHI)
A - Chincha Alta's Latitude is -13.409850 & Longitude is -76.132347.
A - Weather in Chincha Alta is 23° today.
A - Climate Conditions in Chincha Alta shows overcast clouds today.
A - Humidity in Chincha Alta is 77% today.
A - Wind speed in Chincha Alta is 18 km/h, flowing at 281° wind direction. today.
