Baradères, Haiti: Climate and Weather Overview
Located in the southwestern part of Haiti, Baradères is a coastal town known for its stunning natural beauty and tropical climate. Understanding the weather patterns in Baradères is essential for residents, visitors, and businesses operating in the region. In this detailed guide, we will explore the climate and weather in Baradères throughout the year, providing valuable insights for those interested in this picturesque location.
Baradères Climate
Baradères, like the rest of Haiti, experiences a tropical climate marked by distinct wet and dry seasons. The town is characterized by lush greenery, palm-fringed beaches, and warm temperatures year-round, making it an attractive destination for travelers seeking a tropical escape.
Temperature in Baradères
The average annual temperature in Baradères is around 28°C (82°F), with only slight variations throughout the year. The warmest months are typically June through August, with average highs reaching around 31°C (88°F). Even during the coolest months, from December to February, the temperatures remain pleasantly warm, with average lows around 22°C (72°F).
Rainfall in Baradères
Baradères experiences a distinct wet season from May to October, during which the town receives the majority of its annual rainfall. The peak of the wet season is typically in June and September, with heavy but brief downpours being common. The dry season spans from November to April, with significantly less rainfall during this period.
Weather Patterns by Month
Understanding the weather patterns in Baradères month by month can help individuals and businesses make informed decisions regarding travel, outdoor activities, and agricultural practices.
| Month | Temperature (°C) | Temperature (°F) | Rainfall (mm) |
|---|---|---|---|
| January | 24-31 | 75-88 | 20-30 |
| February | 24-31 | 75-88 | 10-20 |
| March | 24-32 | 75-90 | 10-20 |
| April | 25-32 | 77-90 | 10-20 |
| May | 26-33 | 79-91 | 50-100 |
| June | 26-33 | 79-91 | 150-200 |
| July | 26-33 | 79-91 | 150-200 |
| August | 26-33 | 79-91 | 150-200 |
| September | 26-33 | 79-91 | 150-200 |
| October | 26-32 | 79-90 | 100-150 |
| November | 25-32 | 77-90 | 30-50 |
| December | 24-31 | 75-88 | 20-30 |
As illustrated in the table, Baradères experiences relatively consistent temperatures throughout the year, with minimal fluctuations. The months of June through September see the highest levels of rainfall, while the period from November to April is relatively dry and ideal for outdoor activities.
Impact of Climate on Agriculture
The climate in Baradères plays a significant role in shaping agricultural practices in the region. The rainy season provides ample water for crop irrigation, and the consistent temperatures support the growth of a variety of fruits and vegetables. However, excessive rainfall during the wet season can pose challenges for certain crops, requiring farmers to implement strategic cultivation techniques.
Conclusion
Baradères, Haiti, offers a tropical climate characterized by warm temperatures, distinct wet and dry seasons, and lush vegetation. Whether you are planning a visit to enjoy the natural beauty or considering agricultural investments in the region, understanding the climate and weather patterns in Baradères is essential for making well-informed decisions.
By examining the temperature and rainfall data for each month, individuals and businesses can effectively plan activities, mitigate weather-related risks, and harness the natural resources of this picturesque coastal town.
A - Baradères's Latitude is 18.482500 & Longitude is -73.638611.
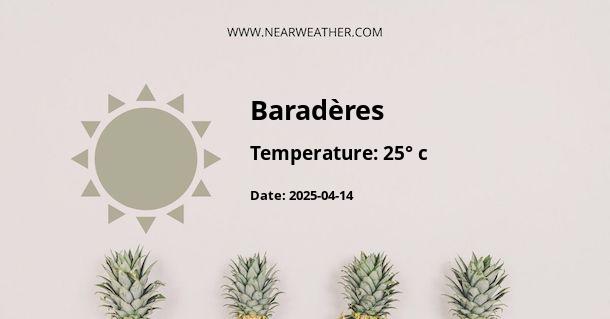
A - Weather in Baradères is 25° today.
A - Climate Conditions in Baradères shows clear sky today.
A - Humidity in Baradères is 80% today.
A - Wind speed in Baradères is 9.4 km/h, flowing at 317° wind direction. today.
