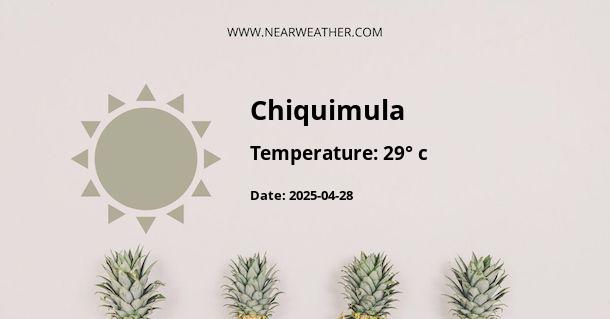
Chiquimula, Guatemala: A Comprehensive Guide to Its Climate and Weather Year Round
Chiquimula, a city located in eastern Guatemala, is known for its diverse climate and weather patterns. Understanding the year-round climate in Chiquimula is essential for residents, visitors, and those considering traveling to the region. In this comprehensive guide, we will explore the climate in Chiquimula throughout the year, including temperature ranges, rainfall patterns, and other important weather-related factors.
Annual Climate Overview
Chiquimula experiences a diverse climate influenced by its geographic location and elevation. The city is situated at an average altitude of 248 meters (814 feet) above sea level, contributing to its unique climate characteristics. The region's climate is classified as tropical savanna, with distinct wet and dry seasons.
Temperature
The temperature in Chiquimula varies throughout the year, with both daily and seasonal fluctuations. The average annual temperature is approximately 24°C (75°F). The hottest months are typically April and May, with average high temperatures reaching around 31°C (88°F). In contrast, the coolest months are December and January, with average lows of 14°C (57°F).
Here is a detailed overview of the average monthly temperatures in Chiquimula:
| Month | Average High (°C) | Average Low (°C) |
|---|---|---|
| January | 25 | 14 |
| February | 27 | 15 |
| March | 29 | 16 |
| April | 31 | 17 |
| May | 31 | 18 |
| June | 29 | 18 |
| July | 28 | 18 |
| August | 28 | 18 |
| September | 28 | 18 |
| October | 27 | 18 |
| November | 26 | 17 |
| December | 25 | 14 |
Rainfall
Chiquimula experiences distinct wet and dry seasons, with the majority of the annual precipitation occurring during the wet season. The rainy season typically spans from May to October, with peak rainfall in June, July, and August. The average annual rainfall in Chiquimula is approximately 900mm (35 inches).
Here is a breakdown of the average monthly rainfall in Chiquimula:
| Month | Rainfall (mm) |
|---|---|
| January | 7 |
| February | 5 |
| March | 5 |
| April | 20 |
| May | 135 |
| June | 250 |
| July | 220 |
| August | 200 |
| September | 180 |
| October | 140 |
| November | 40 |
| December | 12 |
Humidity and Wind
The relative humidity in Chiquimula remains relatively consistent throughout the year, typically averaging around 70%. The prevailing wind patterns are influenced by the region's topography and the seasonal shifts in weather. During the dry season, gentle breezes are common, while the wet season may bring stronger winds, particularly during thunderstorms.
Extreme Weather Events
Chiquimula, like many regions in Central America, is susceptible to tropical storms and hurricanes, particularly during the peak of the hurricane season from August to October. While these events are relatively rare, they have the potential to significantly impact the region, causing heavy rainfall, strong winds, and flash floods.
Conclusion
Chiquimula's climate offers a diverse and dynamic experience throughout the year, showcasing the beauty of both wet and dry seasons. Understanding the region's climate and weather patterns is crucial for residents and visitors alike, allowing for better preparation and informed decision-making when it comes to outdoor activities and travel plans.
Whether you are seeking the warmth of the dry season or the lush greenery of the wet season, Chiquimula's climate has something to offer for everyone. By embracing the unique weather patterns of the region, you can fully appreciate the natural beauty and charm that Chiquimula has to offer.
A - Chiquimula's Latitude is 14.800000 & Longitude is -89.550003.
A - Weather in Chiquimula is 29° today.
A - Climate Conditions in Chiquimula shows few clouds today.
A - Humidity in Chiquimula is 51% today.
A - Wind speed in Chiquimula is 11.12 km/h, flowing at 270° wind direction. today.
