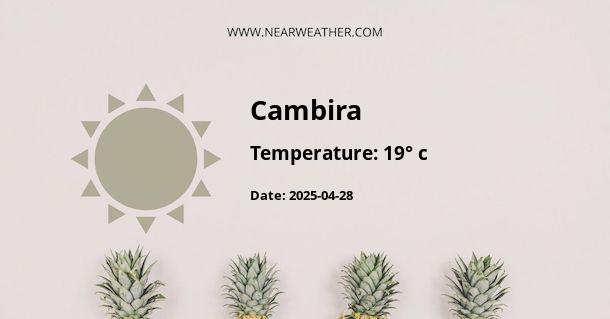
Cambira, Brazil: Climate and Weather Overview
Cambira is a charming municipality located in the state of Paraná, Brazil. This small town is known for its lush greenery, scenic landscapes, and a subtropical climate that offers an enjoyable outdoor experience for visitors and locals alike.
Annual Weather Summary
The climate in Cambira is classified as humid subtropical (Cfa) according to the Köppen climate classification. The town experiences four distinct seasons: spring, summer, autumn, and winter. Each season brings its own unique weather patterns and temperature variations.
Spring (September - November)
During the spring months, Cambira experiences mild temperatures with average highs ranging from 22°C (71.6°F) to 26°C (78.8°F). The weather is generally pleasant, with blooming flora adding to the town's natural beauty. Spring is a great time to explore the surrounding nature reserves and enjoy outdoor activities.
Summer (December - February)
Summer in Cambira is characterized by warm and humid weather. Average temperatures range from 24°C (75.2°F) to 31°C (87.8°F). The town receives a generous amount of rainfall during the summer months, which contributes to the area's lush vegetation and agricultural productivity.
Autumn (March - May)
Autumn brings milder temperatures and less humidity to Cambira. Average highs range from 21°C (69.8°F) to 25°C (77°F). The autumn foliage paints the town in beautiful warm hues, making it an ideal time for nature walks and sightseeing.
Winter (June - August)
Winter in Cambira is relatively mild compared to many other parts of Brazil. The average temperatures range from 14°C (57.2°F) to 19°C (66.2°F). While it can get chilly, especially during the night, snow is extremely rare in this region. Winter is a great time to experience the local culture and cuisine in Cambira.
Precipitation and Sunshine
Cambira receives an average annual precipitation of around 1,600 mm (63 inches). The rainiest months are typically from October to March, with December being the wettest month. The town enjoys an abundance of sunshine throughout the year, with an average of 2,800 hours of sunshine annually.
Climate Chart
The following climate chart provides a visual representation of the average monthly temperature and precipitation in Cambira throughout the year:
| Month | Average High (°C) | Average Low (°C) | Precipitation (mm) |
|---|---|---|---|
| January | 30 | 19 | 180 |
| February | 30 | 19 | 170 |
| March | 29 | 18 | 160 |
| April | 27 | 16 | 120 |
| May | 25 | 13 | 90 |
| June | 23 | 11 | 80 |
| July | 23 | 11 | 80 |
| August | 24 | 12 | 90 |
| September | 25 | 14 | 110 |
| October | 27 | 16 | 130 |
| November | 28 | 17 | 150 |
| December | 29 | 18 | 170 |
Weather-Related Activities
Given its pleasant climate and natural surroundings, Cambira offers several outdoor activities that visitors can enjoy throughout the year:
- Exploring the local nature reserves and hiking trails
- Participating in eco-tourism activities
- Visiting agricultural farms and orchards
- Attending local festivals and cultural events
Conclusion
With its humid subtropical climate, Cambira provides a delightful escape for those seeking a blend of natural beauty and favorable weather conditions. Whether it's the vibrant colors of spring, the warmth of summer, the picturesque autumn, or the mild winter, Cambira's climate offers something for everyone. Visitors can indulge in year-round outdoor activities and immerse themselves in the town's rich cultural heritage while enjoying the town's inviting climate.
For more detailed and up-to-date weather information, it is recommended to consult local weather forecasts and resources when planning a visit to Cambira.
A - Cambira's Latitude is -23.582781 & Longitude is -51.578331.
A - Weather in Cambira is 19° today.
A - Climate Conditions in Cambira shows light rain today.
A - Humidity in Cambira is 98% today.
A - Wind speed in Cambira is 4.79 km/h, flowing at 288° wind direction. today.
