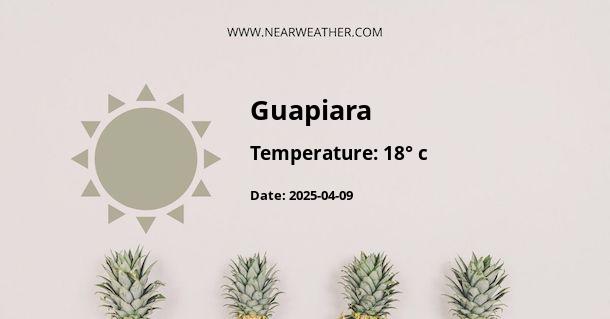
Weather and Climate in Guapiara, Brazil
Welcome to Guapiara, a beautiful municipality located in the state of São Paulo, Brazil. Guapiara enjoys a diverse climate, with distinct seasons and varying weather patterns throughout the year. Let's explore the detailed weather and climate information for this fascinating location.
Seasonal Climate Overview
Guapiara experiences a humid subtropical climate, typical of the region, characterized by hot and humid summers and mild winters. The area is known for its lush vegetation and abundant rainfall, making it an ideal environment for diverse flora and fauna.
Summer (December to February)
During the summer months, Guapiara experiences warm and humid conditions, with average high temperatures ranging from 28°C to 32°C (82°F to 89°F). The area receives a significant amount of rainfall during this season, contributing to the rich greenery and natural beauty of the region.
Autumn (March to May)
Autumn brings milder temperatures to Guapiara, with average highs ranging from 24°C to 28°C (75°F to 82°F). The rainfall levels start to decrease as the season progresses, leading to pleasant and comfortable weather conditions.
Winter (June to August)
Winter in Guapiara is relatively mild, with average high temperatures ranging from 20°C to 24°C (68°F to 75°F). While the area experiences cooler temperatures during this season, it is not uncommon for occasional frosts to occur, adding a touch of charm to the landscape.
Spring (September to November)
Spring brings a rejuvenation of the natural surroundings in Guapiara, with average high temperatures ranging from 24°C to 28°C (75°F to 82°F). The season is also characterized by an increase in rainfall, contributing to the blooming of vibrant flowers and lush vegetation.
Precipitation and Rainfall
Guapiara receives a significant amount of rainfall throughout the year, contributing to its thriving ecosystem and verdant landscapes. The annual precipitation in the area averages around 1,500 to 1,800 millimeters, with the highest levels occurring during the summer months.
The distribution of rainfall is relatively uniform, with occasional heavy downpours, especially during the summer season. This consistent rainfall plays a vital role in supporting the diverse flora and fauna that call Guapiara home.
Climate Data Table
Let's take a closer look at the average climate data for Guapiara, showcasing the monthly temperature and precipitation levels.
| Month | Average High (°C) | Average Low (°C) | Precipitation (mm) |
|---|---|---|---|
| January | 30 | 19 | 250 |
| February | 31 | 19 | 220 |
| March | 29 | 18 | 190 |
| April | 27 | 16 | 130 |
| May | 25 | 13 | 90 |
| June | 23 | 12 | 70 |
| July | 23 | 12 | 70 |
| August | 24 | 13 | 90 |
| September | 26 | 14 | 120 |
| October | 28 | 16 | 160 |
| November | 29 | 17 | 200 |
| December | 30 | 18 | 240 |
Climate Chart
Visualizing the climate data can provide a clearer understanding of the seasonal variations in Guapiara. The following chart illustrates the average monthly temperature and precipitation levels throughout the year.

Conclusion
Guapiara offers a captivating blend of natural beauty and diverse climate, creating an inviting environment for residents and visitors alike. The area's consistent rainfall and mild temperatures contribute to its flourishing ecosystem and picturesque landscapes throughout the year. Whether you're exploring the verdant rainforests or simply enjoying the pleasant weather, Guapiara's climate provides a delightful experience for all.
When planning your visit to Guapiara, be sure to consider the seasonal variations and pack accordingly to make the most of your time in this enchanting municipality.
A - Guapiara's Latitude is -24.184999 & Longitude is -48.532780.
A - Weather in Guapiara is 18° today.
A - Climate Conditions in Guapiara shows overcast clouds today.
A - Humidity in Guapiara is 97% today.
A - Wind speed in Guapiara is 0.65 km/h, flowing at 74° wind direction. today.
