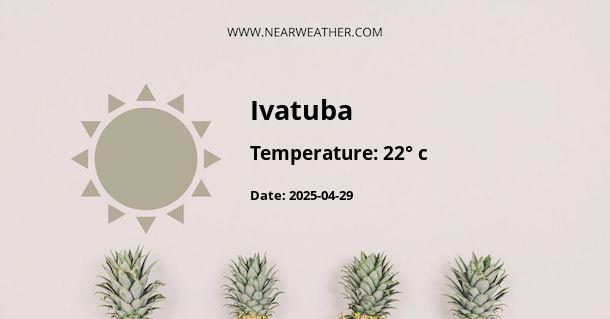
Climate and Weather in Ivatuba, Brazil
Ivatuba is a municipality located in the state of Parana in Brazil. The town experiences a tropical climate with distinct wet and dry seasons, typical of many regions in Brazil. Understanding the climate and weather patterns in Ivatuba is essential for residents, travelers, and businesses operating in the area. This comprehensive guide provides an overview of Ivatuba's climate, including temperature, precipitation, and seasonal variations throughout the year.
Temperature
The temperature in Ivatuba remains relatively warm throughout the year due to its tropical climate. The average annual temperature is around 23°C (73°F). However, there is some variation between the hottest and coolest months. The hottest months are typically from November to March, with average temperatures ranging from 30°C to 35°C (86°F to 95°F). In contrast, the coolest months are from May to August, with average temperatures ranging from 15°C to 20°C (59°F to 68°F). This temperature fluctuation creates a noticeable difference between the wet and dry seasons.
Precipitation
Ivatuba experiences distinct wet and dry seasons. The wet season typically occurs from October to March, with the highest precipitation levels in December and January. During this period, heavy rainfall and thunderstorms are common, contributing to the region's tropical rainforest climate. The dry season, on the other hand, occurs from April to September, with significantly lower precipitation levels. The average annual precipitation in Ivatuba is around 1,500mm (59 inches).
Seasonal Variations
The seasonal variations in Ivatuba are primarily defined by the alternating wet and dry seasons. During the wet season, the town experiences lush greenery and vibrant flora due to the ample rainfall. Rivers and water bodies are replenished, providing a picturesque landscape. However, the wet season also brings the risk of flooding and heightened humidity levels. In contrast, the dry season sees a reduction in precipitation, leading to drier conditions and a temporary decrease in humidity. This period is characterized by a more arid landscape and is ideal for outdoor activities and agricultural pursuits.
Climate Data for Ivatuba
For a more detailed understanding of Ivatuba's climate, the table below provides a breakdown of average monthly temperatures and precipitation levels throughout the year:
| Month | Temperature (°C) | Precipitation (mm) |
|---|---|---|
| January | 30 | 200 |
| February | 31 | 180 |
| March | 31 | 170 |
| April | 28 | 100 |
| May | 26 | 70 |
| June | 24 | 50 |
| July | 24 | 40 |
| August | 26 | 50 |
| September | 27 | 80 |
| October | 28 | 120 |
| November | 29 | 150 |
| December | 30 | 190 |
Conclusion
In conclusion, Ivatuba's climate is characterized by its tropical weather, with distinct wet and dry seasons shaping the town's environmental conditions. By understanding the temperature fluctuations, precipitation levels, and seasonal variations, residents, travelers, and businesses can better prepare for and adapt to the prevailing weather patterns throughout the year.
A - Ivatuba's Latitude is -23.618610 & Longitude is -52.221390.
A - Weather in Ivatuba is 24° today.
A - Climate Conditions in Ivatuba shows overcast clouds today.
A - Humidity in Ivatuba is 42% today.
A - Wind speed in Ivatuba is 6.37 km/h, flowing at 78° wind direction. today.
