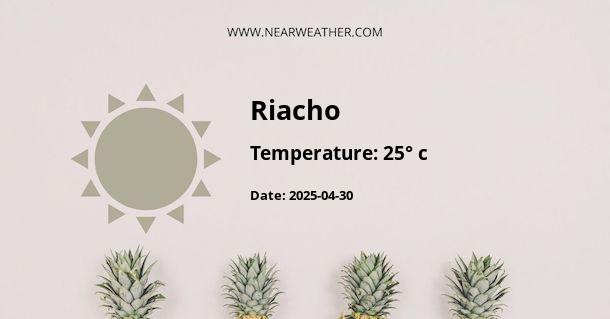
Riacho, Brazil Weather and Climate Overview
Riacho is a charming municipality located in the state of Minas Gerais, Brazil. As with many regions in Brazil, Riacho experiences a diverse climate with distinct seasons throughout the year. Understanding the weather patterns and climate of Riacho is essential for residents, tourists, and businesses operating in the area. Let's take a closer look at the weather and climate in Riacho, including temperature, precipitation, and seasonal variations.
Temperature in Riacho
Riacho experiences a tropical savanna climate, characterized by hot and humid weather for a significant portion of the year. The average annual temperature in Riacho is around 23°C (73°F), with relatively minor fluctuations between the warmest and coolest months.
The hottest months in Riacho are typically October through March, with average high temperatures ranging from 30°C to 33°C (86°F to 91°F). The coolest months are from May to August, with average lows of 15°C to 18°C (59°F to 64°F).
Riacho's temperature fluctuations are relatively moderate compared to some other regions in Brazil, providing a relatively stable climate for both residents and visitors.
Precipitation in Riacho
Riacho experiences a distinct wet and dry season, typical of tropical savanna climates. The wet season in Riacho spans from October to March, while the dry season extends from April to September.
During the wet season, Riacho receives the majority of its annual precipitation. The average annual rainfall in Riacho is approximately 1100mm (43 inches). The wettest months are typically November and December, with significant rainfall that contributes to the lush greenery and biodiversity of the region.
Conversely, the dry season in Riacho brings significantly lower rainfall, with the months of June, July, and August being the driest. The combination of temperature and rainfall patterns creates a unique ecosystem in Riacho, with diverse flora and fauna adapted to the seasonal variations.
Seasonal Variations
The distinct seasons in Riacho bring about notable changes in the environment and local activities. During the wet season, the surrounding countryside flourishes with vibrant vegetation, making it an ideal time for nature enthusiasts to explore the region's natural beauty. The dry season brings a different charm, with clear skies and cooler temperatures providing favorable conditions for outdoor excursions and cultural events.
Climate Charts and Data
To provide a comprehensive overview of Riacho's climate, the following table summarizes the average monthly temperature and precipitation patterns:
| Month | Average Temperature (°C) | Precipitation (mm) |
|---|---|---|
| January | 31 | 150 |
| February | 31 | 140 |
| March | 31 | 135 |
| April | 30 | 85 |
| May | 29 | 40 |
| June | 28 | 30 |
| July | 28 | 25 |
| August | 29 | 30 |
| September | 30 | 60 |
| October | 31 | 110 |
| November | 31 | 140 |
| December | 31 | 150 |
These average values provide a clear understanding of the temperature and precipitation fluctuations throughout the year in Riacho, aiding in planning various activities and events.
Conclusion
Riacho's climate and weather patterns offer a beautiful and diverse environment, making it an attractive destination for travelers and nature enthusiasts. By understanding the temperature, precipitation, and seasonal variations, visitors and residents can fully appreciate the unique charm of Riacho throughout the year.
Whether exploring the lush landscapes during the wet season or enjoying outdoor adventures during the dry season, Riacho's climate provides a rich tapestry for all to experience and enjoy.
A - Riacho's Latitude is -9.250000 & Longitude is -35.383331.
A - Weather in Riacho is 25° today.
A - Climate Conditions in Riacho shows clear sky today.
A - Humidity in Riacho is 81% today.
A - Wind speed in Riacho is 12.38 km/h, flowing at 45° wind direction. today.
