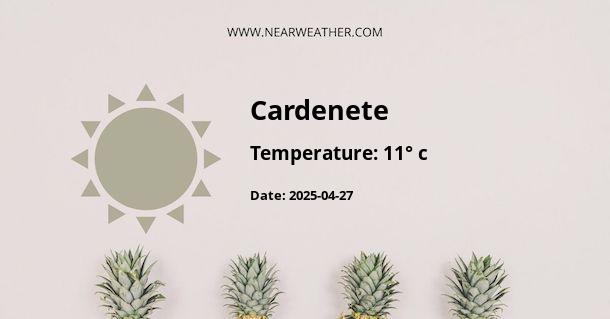
Climate and Weather in Cardenete, Spain
Cardenete is a charming village located in the province of Cuenca, in the autonomous community of Castilla-La Mancha, Spain. The village is known for its picturesque landscapes, historical sites, and a Mediterranean climate that offers pleasant weather throughout the year. Let's explore the climate and weather patterns in Cardenete in more detail.
Temperature
The temperature in Cardenete varies significantly throughout the year, with distinct seasons that bring different weather conditions. Summers are generally hot, while winters can be colder with occasional frost and snowfall. Here's a breakdown of the average temperature in Cardenete:
| Month | Average High (°C) | Average Low (°C) |
|---|---|---|
| January | 8 | 0 |
| February | 11 | 1 |
| March | 14 | 3 |
| April | 17 | 6 |
| May | 21 | 9 |
| June | 26 | 13 |
| July | 30 | 16 |
| August | 30 | 16 |
| September | 26 | 12 |
| October | 20 | 8 |
| November | 13 | 3 |
| December | 9 | 1 |
As the table shows, temperatures in Cardenete reach their peak during July and August, with average highs of around 30°C. On the other hand, the coldest months are January and February, with average lows dropping to 0°C. It's important to note that these are average temperatures, and extreme weather conditions can occur from time to time.
Precipitation
Cardenete experiences a moderate amount of rainfall spread throughout the year, with a slightly drier period during the summer months. Here's an overview of the average precipitation in Cardenete:
| Month | Average Precipitation (mm) |
|---|---|
| January | 30 |
| February | 25 |
| March | 25 |
| April | 40 |
| May | 50 |
| June | 30 |
| July | 10 |
| August | 10 |
| September | 25 |
| October | 40 |
| November | 35 |
| December | 30 |
As the table indicates, the wettest months in Cardenete are May and October, with an average precipitation of around 50mm. On the other hand, July and August are the driest months, with only around 10mm of rainfall on average. The rainfall distribution throughout the year ensures that the region remains green and vibrant.
Sunshine Hours
The village of Cardenete enjoys a good amount of sunshine hours, particularly during the summer months. The sunny weather adds to the pleasant climate and enhances the overall experience of being in the village. Here's an overview of the average sunshine hours in Cardenete:
| Month | Average Sunshine Hours |
|---|---|
| January | 5 |
| February | 6 |
| March | 7 |
| April | 8 |
| May | 9 |
| June | 11 |
| July | 12 |
| August | 11 |
| September | 9 |
| October | 7 |
| November | 5 |
| December | 4 |
As the table illustrates, the sunniest months in Cardenete are July and August, with an average of 12 hours of sunshine per day. The winter months receive less sunshine, with December having the fewest hours of sunshine at an average of 4 hours per day. Nonetheless, the overall sunshine hours in Cardenete contribute to a pleasant and enjoyable climate for both residents and visitors.
Conclusion
Cardenete experiences a Mediterranean climate with hot summers and colder winters. The average temperature ranges from 8°C in January to 30°C in July and August. The village receives moderate rainfall throughout the year, with May and October being the wettest months. It also enjoys a good amount of sunshine hours, peaking during July and August. The climate in Cardenete makes it an ideal destination for outdoor activities and exploring the beautiful natural landscapes of the region.
A - Cardenete's Latitude is 39.766670 & Longitude is -1.683330.
A - Weather in Cardenete is 11° today.
A - Climate Conditions in Cardenete shows clear sky today.
A - Humidity in Cardenete is 55% today.
A - Wind speed in Cardenete is 22.25 km/h, flowing at 21° wind direction. today.
